
How to draw a system design diagram
A useful architecture diagram explains how a request moves through a system. Start with a small working design, label the important paths, and add complexity when a requirement gives you a reason to do so.
By Nitin Kumar and Mayank Singh · Updated October 9, 2026
New to the editor? Watch the quick Hello Drawing walkthrough for tool shortcuts, Draw to shape, and searching for architecture symbols. Then use this guide to decide what belongs in your diagram.
1. Write down the requirements
Before drawing boxes, name the user action, the result, and the constraints. For a URL shortener, the core actions are creating a short link and opening it. Decide whether links expire, whether custom aliases are needed, and what should happen when a link is missing. Put these assumptions beside the diagram.
2. Draw the smallest working request path
Use a browser box, a service box, and a database box. Connect them with arrows and label what crosses each boundary. A box named “URL service” is more useful than an unexplained “backend”; an arrow labeled “lookup code” says more than an unlabeled connector.
In Hello Drawing's free online whiteboard, use rectangles for components, text for responsibilities, and arrows for requests. Bind arrow ends to shapes so they follow when you move a component. Use the native editor's alignment controls to keep related components easy to scan.
Draw generic components with native rectangles and ellipses, then label them Client, Server, and Database. For a branded component, type Redis or Postgres over empty canvas and choose a logo. Logos are images with separate editable labels. Use arrows and request labels to explain the role of each component.
3. Separate writes from reads
Trace one operation at a time. Creating a link writes a mapping from a unique code to a destination URL. Opening a link reads that mapping and returns an HTTP redirect. Number the steps or use separate labels so the reader can follow both paths without guessing.
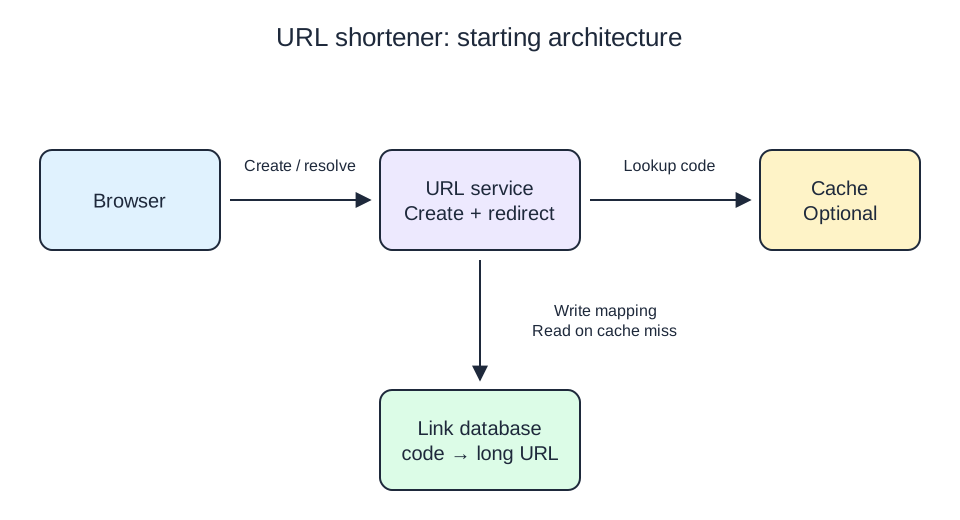
Get the editable URL shortener diagram and walkthrough.
4. Add scale only after estimating the load
Estimate peak reads and writes separately. Average requests per second are daily requests divided by 86,400; peak traffic needs a separate assumption. Storage starts with link count multiplied by estimated record size, then adds indexes and replication. State your inputs instead of presenting an unexplained capacity number.
A worked capacity estimate
Suppose your exercise has 1 million new links and 100 million redirects per day. That is about 12 writes and 1,157 reads per second on average. Assuming a peak of five times the average gives about 58 writes and 5,787 reads per second. The peak multiplier is an assumption to discuss, not a guarantee. At 500 bytes per mapping, a year of new links needs about 182.5 GB of raw records, before indexes, replication, backups, or expired-link cleanup.
Write these numbers next to the corresponding paths. Then ask whether a simple service and database meet the load, and what measurements would justify adding the optional cache. Do not present these example numbers as the capacity of a particular database or deployment.
If repeated redirects overload the database, a cache may help. If the service becomes a bottleneck, consider multiple service instances behind a load balancer. Add each component alongside the problem it solves and the failure mode it introduces. Neither belongs in every first draft.
5. Explain failures and trade-offs
- Missing or expired code: return a clear error instead of redirecting to an unknown destination.
- Duplicate generated code: enforce uniqueness in storage and retry generation on a collision.
- Cache failure: decide whether the database can absorb fallback reads.
- Changed or removed links: explain how cached mappings expire or are invalidated.
- Abuse: consider unsafe destinations, automated link creation, and how reports are handled.
6. Review and save your diagram
- Can a reader trace link creation and a redirect without your narration?
- Does each arrow say what moves across it, and in which direction?
- Are cache misses, code collisions, and missing links explained?
- Are estimates tied to explicit assumptions instead of unexplained scale claims?
- Can you remove a component without breaking a stated requirement?
Walk through one successful request and one failure aloud. Check that every arrow has a purpose and every storage box says what it stores. Download an editable drawing file to continue later; export PNG or SVG when you need an image for notes. Browser autosave is local to your device, so keep a downloaded backup.
For an interview rehearsal with another person, use the existing temporary collaboration session. Have one person trace requests while the other challenges failure assumptions. Session drawings are not autosaved, so download your work before leaving.
Start a system design drawing, try the URL shortener template, or learn the drawing keyboard shortcuts.